The 7 Best Software for Graphing
Affiliate Disclosure
This article contains affiliate links. If you make a purchase through these links, I may earn a commission at
no additional cost to you.
Here’s my curated list of the 7 best software for Graphing, in no particular order.
- Visme — Combines infographic design with presentation tools, making it suitable for engaging visual storytelling.
- Lucidchart — A diagramming application perfect for creating urban designs and workflows seamlessly.
- ChartBlocks — A user-friendly chart builder that allows users to create and share charts in minutes.
- EasyChart — EasyChart simplifies the creation of interactive charts and comes with a variety of data visualization options.
- Mapsly — Mapsly is perfect for creating interactive maps and visualizations with geospatial data integration.
- Piktochart — Enables bloggers to create infographics and visuals easily, enhancing their content's appeal.
- Datawrapper — An easy-to-use tool for creating charts and maps that can be embedded in websites and reports.

Looking for Productivity Books?
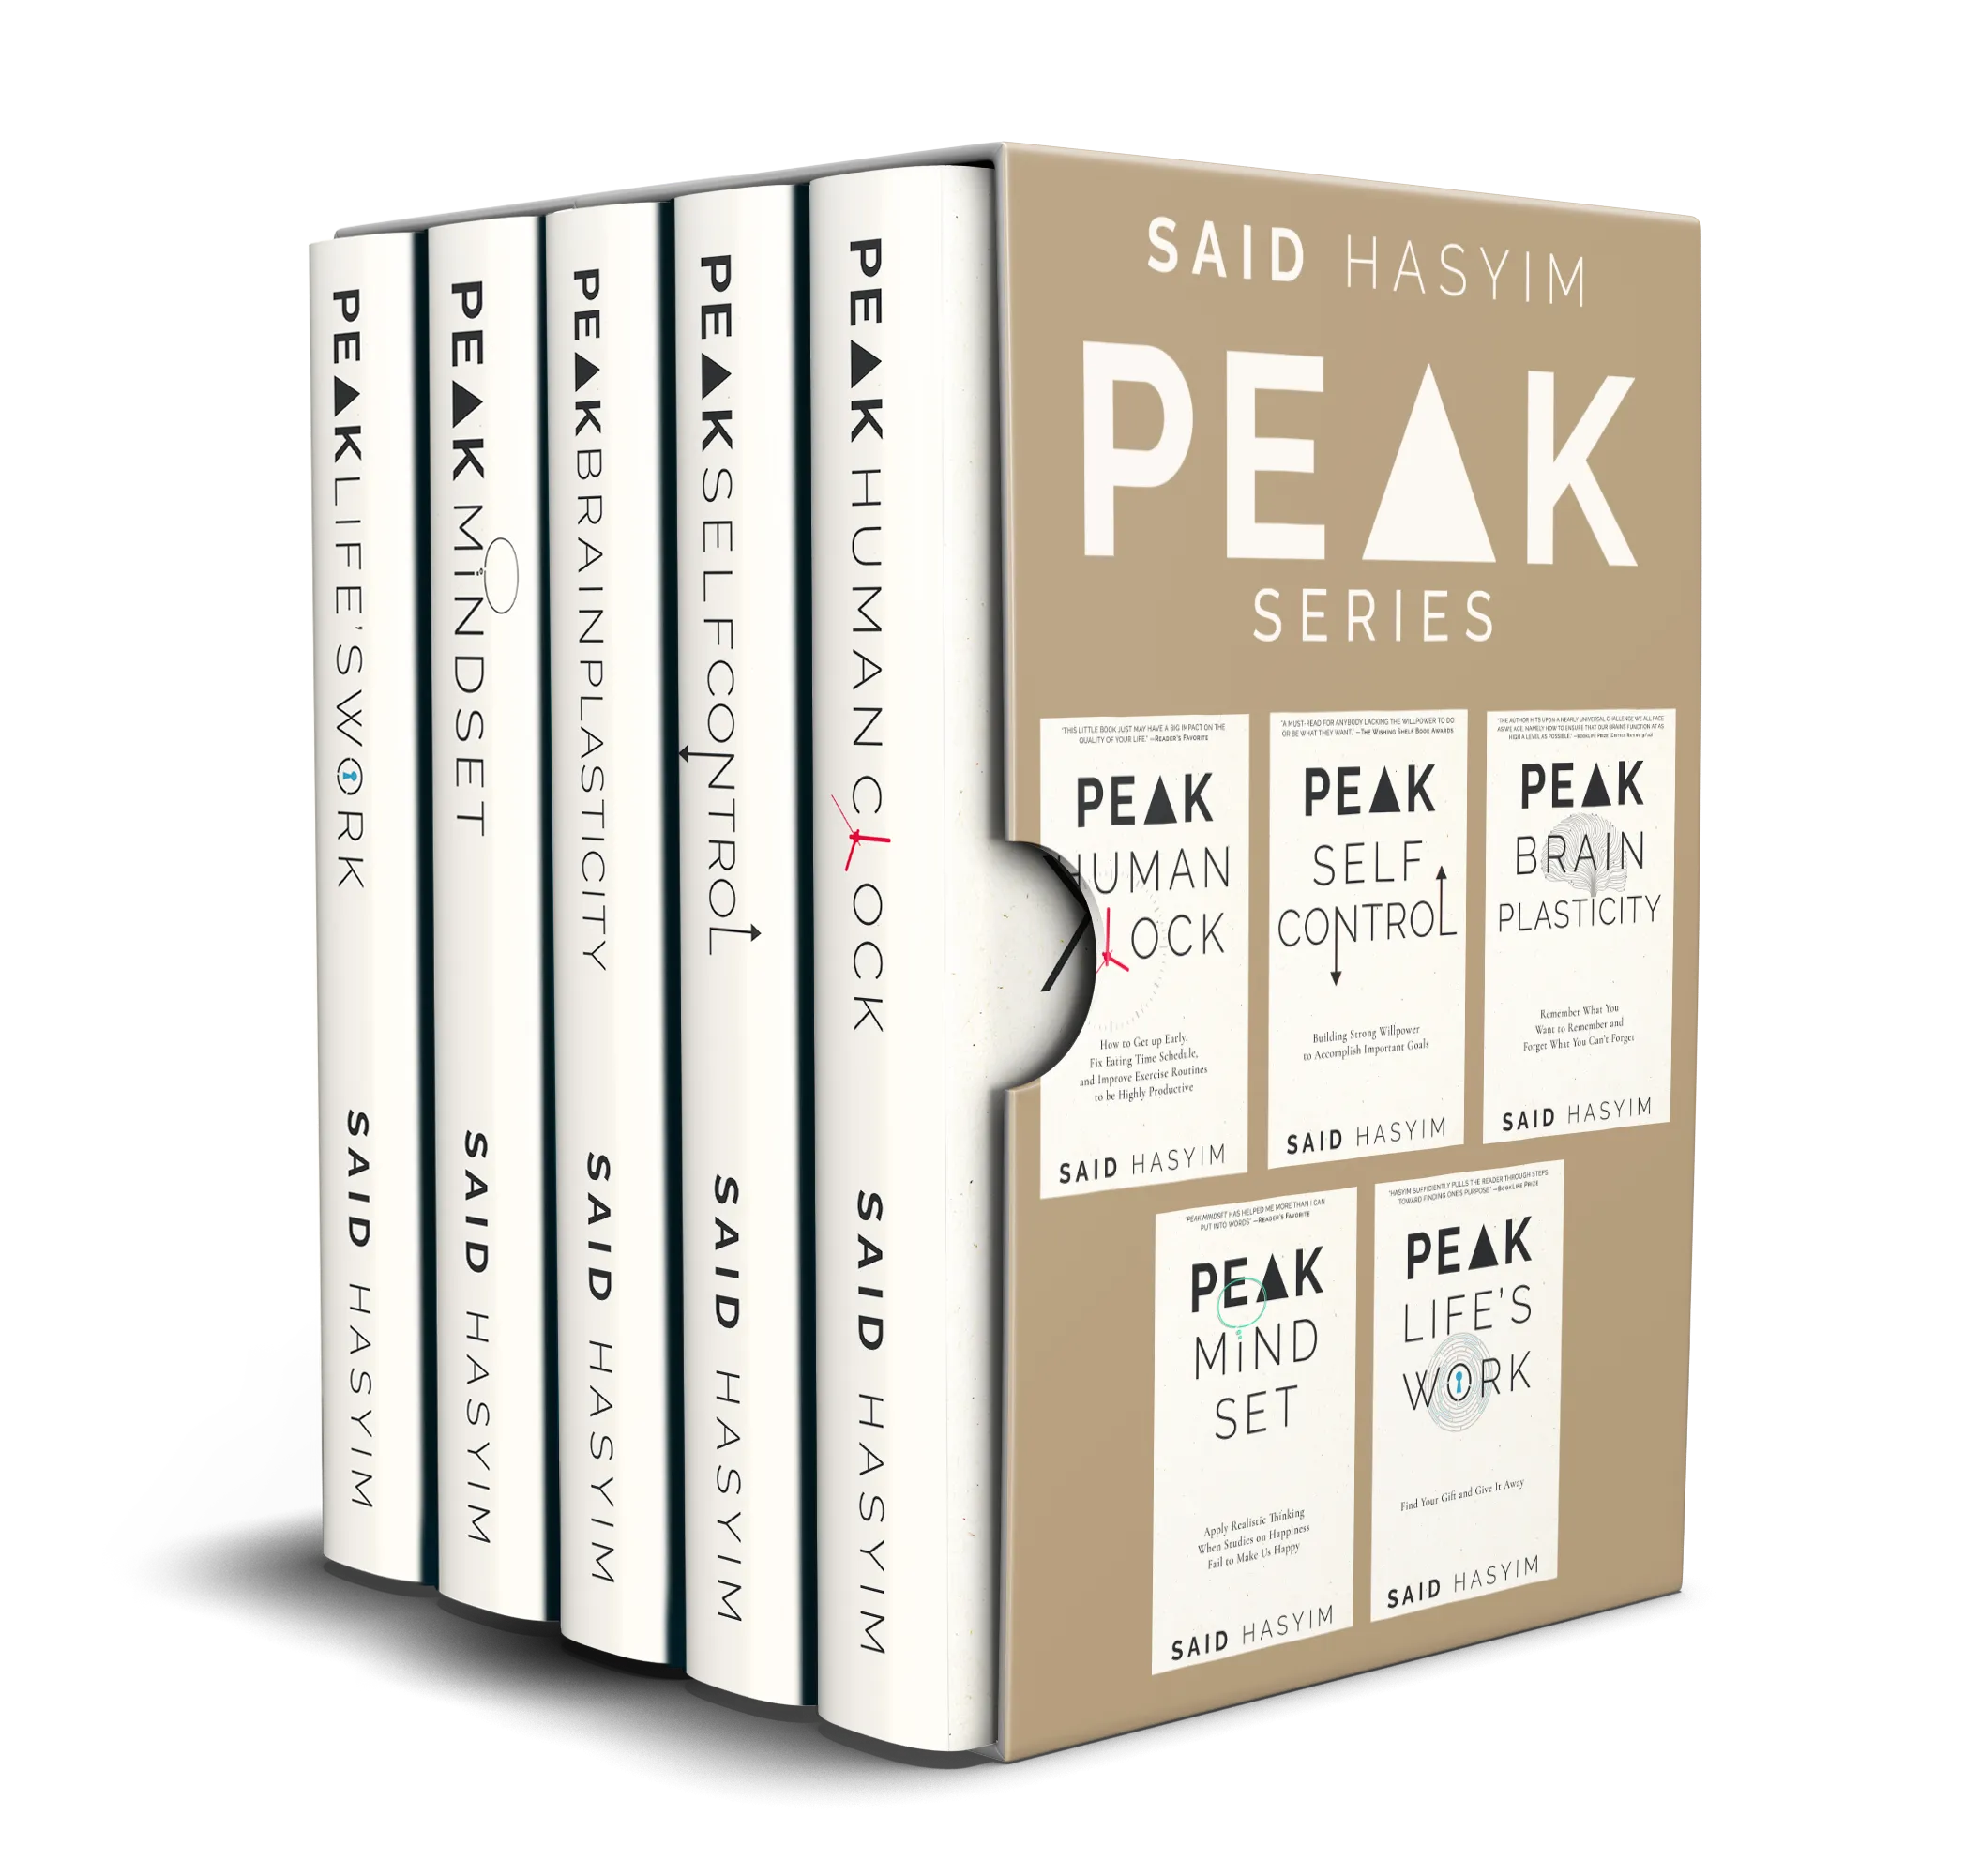
Check out my Peak Productivity Book Series. Maximize your health, self-control, brain power, and mindset to enhance your performance and transform your life.